What effect does each out type in baseball have on a team's probability to score?
No batter likes making an out but even the best hitters are unavailable to avoid this outcome in two out of three at-bats. Some outs, however, affect a team’s probability of scoring more than others. This article examines how different out types (strikeouts, groundouts, flyouts, etc) affect run probability in certain in-game contexts. We look at the number of runners on base, the location of the lead runner, and the number of outs before the at-bat.
Using the baseball package, we accessed 2019 play by play data from retrosheet. Since hits, walks, and HBPs were not of interest to us, we filtered the data down to only at-bats that resulted in an out. We then added a column indicating whether or not a run scored after the out. This became our response variable. If a run scored after the out, that tells us the out was productive or at least not harmful enough to stifle the offense.
First, we explored the empirical probability of scoring after an out, categorizing it by the following four variables:
Out type
Location of lead runner
Number of runners on base
Number of outs

A lot of this information is not very surprising: the more runners on the base the higher the probability of scoring after an out, as outs increase, probability decreases, and probability increases as the location of the lead runner increases. What is interesting to examine is the out types chart. In this context-independent analysis, fly balls seem to decrease the probability of scoring the least, while strikeouts decrease the most, though not by much. From this, we can infer that of all the outs, it is harder to score after a strikeout than any other type of out (generally speaking, not factoring in different scenarios).
Next, we looked specifically at how each out type affects the probability of scoring after the out based on where the lead runner is on base.

We see that fly balls in situations with runners on third is by far the most beneficial when it comes to probability of scoring. Strikeouts, meanwhile, are the worst type of out possible in that situation. This seems to be the general trend for most scenarios, apart from one which stands out for a clear reason. When the lead runner is on first, we see ground outs, not strikeouts are at the bottom of scoring probability. This of course, is because there is a double play possibility with the runner on first, which in fact leads to this next bar chart below.
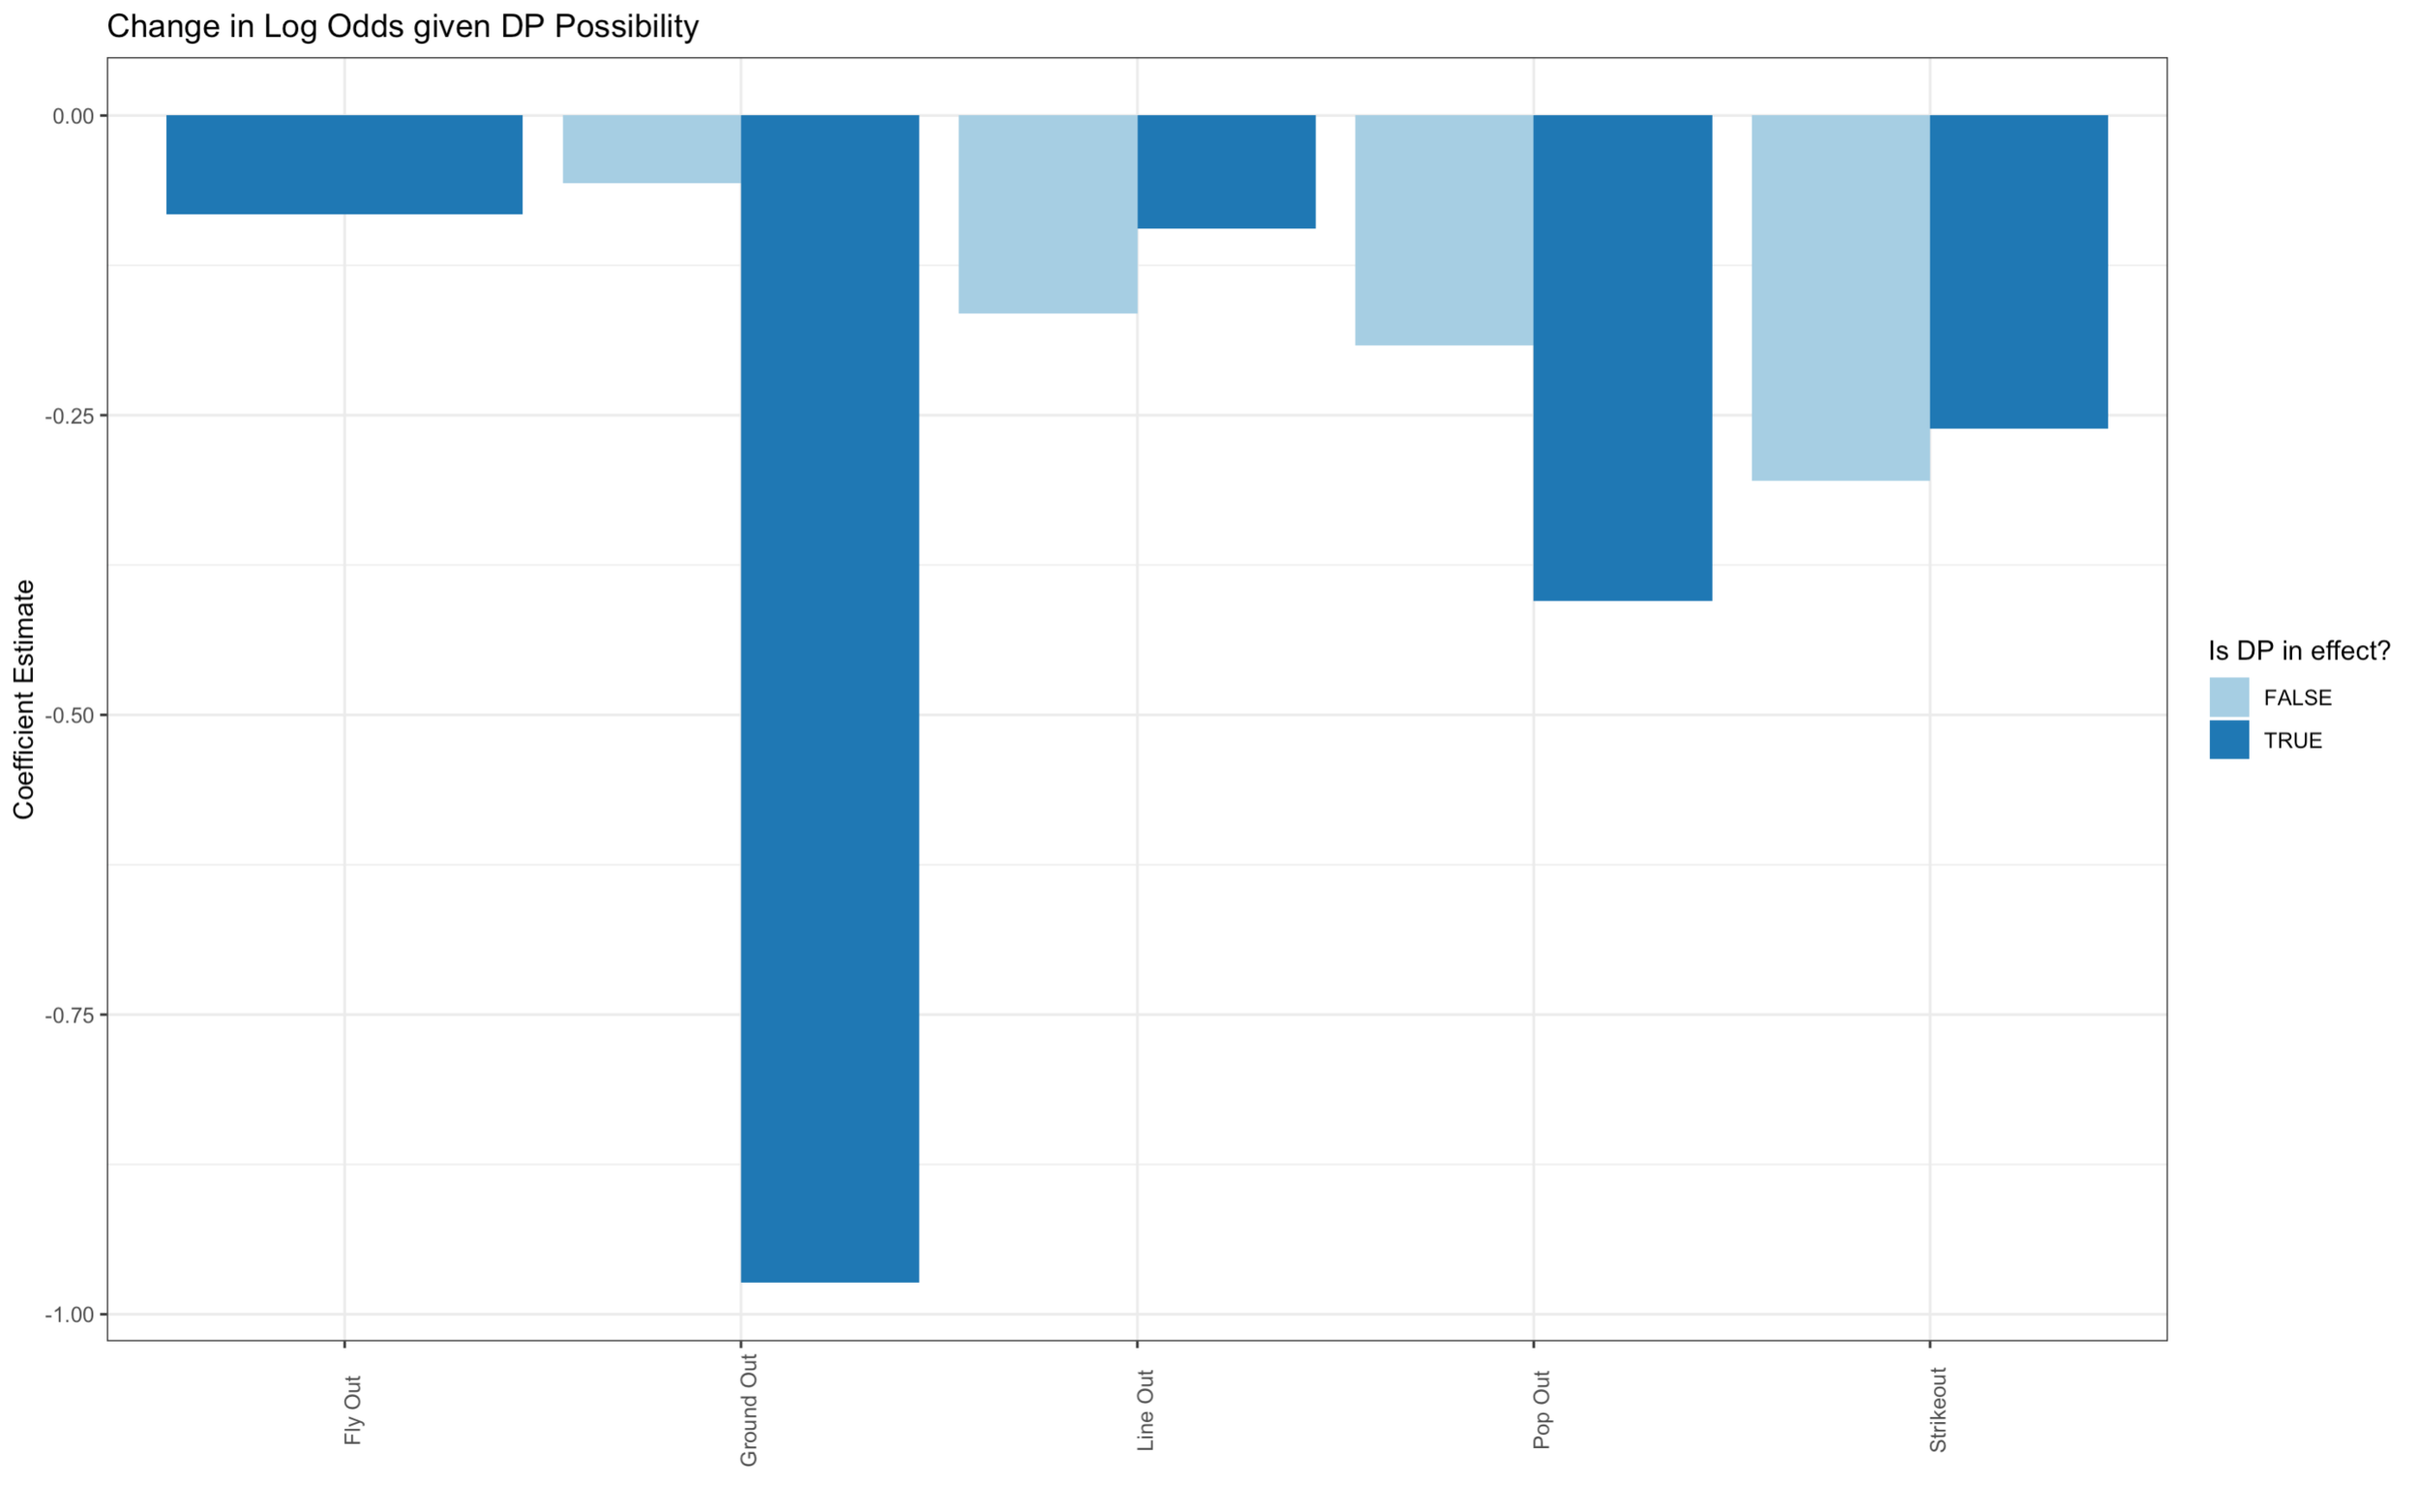
We see that ground balls, as we saw similarly in the other graph, are extremely harmful to a team’s scoring probability, decreasing the log odds of scoring by about -0.974 when a double play is in effect. We can also notice that fly balls decrease log odds the least: a -0.0825 decrease in log odds with a double play in effect, and no decrease when there is no double play in effect. In other words, fly balls are the most “productive” out in that its effects are less harmful to a team’s scoring probability than other outs.
Through this information, we see that run production more commonly occurs following flyouts, and on the flip side, there is a lower percent chance of scoring following a strikeout. While these may not be mind blowing discoveries that can alter game strategies in the MLB, or in any level of baseball, it was certainly interesting to examine how exactly each type of out affects the probability of scoring.
Thank you to Caleb Pena for assisting with the writing and research for this post.