Expected Wins in the NFL and MLB

Gottschalk, Zack. “Mariners Walk It off as Only They Can.” Lookout Landing, 2021, www.lookoutlanding.com/2021/8/14/22624458/mariners-walk-it-off-as-only-they-can.
When Bill James wrote his abstract in 1985, he broke the standard of how to assess MLB statistics and ultimately changed the way we view and think about the game. One of the key concepts he explains in his abstract is the pythagorean win theorem.
Pythagorean heavily weighs the ability of teams to score runs, and their ability to prevent runs. It focuses on the process not results; how teams are winning, rather than if they are actually winning or not. Scoring points is the only way teams win, and a team’s ability to score more than they give up is the sign of a very strong team.
We will examine the correlation between pythagorean wins in both leagues and what teams have the “luckiest” or “unluckiest” based on pythagorean wins.
First, let’s examine the pythagorean wins in the NFL. Football uses a slightly different formula given that there are only 16 games played (before this upcoming season) and points are weighed differently than in baseball.


As we can see, there definitely is a correlation between pythagorean expected wins and actual wins with a correlation of 0.912, which is very strong. Since football is a game of unpredictability, where most games are won within one possession, most teams have an expected wins of under 12. Based on this, the Ravens had the highest pythagorean wins, as they gave up a league low 303 points and 7th most points scored. The Jets, to no surprise, were the lowest in pythagorean wins, with 2.93, behind the Jaguars with 3.9.
To get a bigger sample size, let’s examine a similar correlation, but from 2015-2020.

There is still a correlation with the larger sample size, although it is a slightly weaker correlation, at 0.889. In this graph, the highest pythagorean wins is the 2019 Baltimore Ravens with 13.081. The mean of the Pythagorean expected wins from these 5 years is 7.89, as shown with the vertical red line, and the mean of the actual wins is 8 as shown with the horizontal red line. Essentially, the line helps us distinguish the over performing teams from the underperforming.
Top right: an overall good team that excels in scoring points which allows them to have above average wins and pythagorean wins.
Bottom right: under performing team whose expected wins exceed their actual wins.
Bottom Left: poor results in both wins and pythagorean wins
Top Left: over performing in wins, poor pythagorean wins
Now for the fun part: Let’s take a look at the luckiest and unluckiest teams based on pythagorean wins in the past 5 years.

We can see that the 2020 Chiefs lead the pythagorean difference category with 3.5. They had 8 of their 16 regular season games finish in one score games. However, for 12+ win teams, it seems common that they have a higher pythagorean difference from their pythagorean wins to their actual wins.
In fact according to this graph, and its low correlation of 0.366, there seems to be a very weak relationship between the wins and pythagorean wins for teams with 12+ wins.

Moving on, we now will examine the unluckiest teams.

Leading the “unluckiest” teams is the 2020 Falcons who underperformed their expected wins (no surprise given what the Falcons have been known to do in the past 5 years). Some interesting takeaways is that teams with 5 or less wins appear on this list quite often, yet there are some teams who underperformed with 5+ wins. Some examples include the 2019 Cowboys in 2019 and the 2017 Jaguars. The Cowboys went just 8-8 that season, but had a 113 point differential which would give them a pythagorean win total of around 10, and thus a pythagorean difference of -2.74. With the 2017 Jaguars, we see a 10-6 record, but a team that still underperformed, with an expected pythagorean win total of 11.85 which is actually the 4th highest pythagorean win total of all teams from 2015-2020.

Remember that this is the same team that stunned the world by reaching the AFC Conference Championship before falling to the Patriots. Perhaps this specific example gives us further insight in how to assess a team’s true success through regular season.
Now we will move on to pythagorean wins in the MLB. In baseball, this formula is used to calculate pythagorean wins:

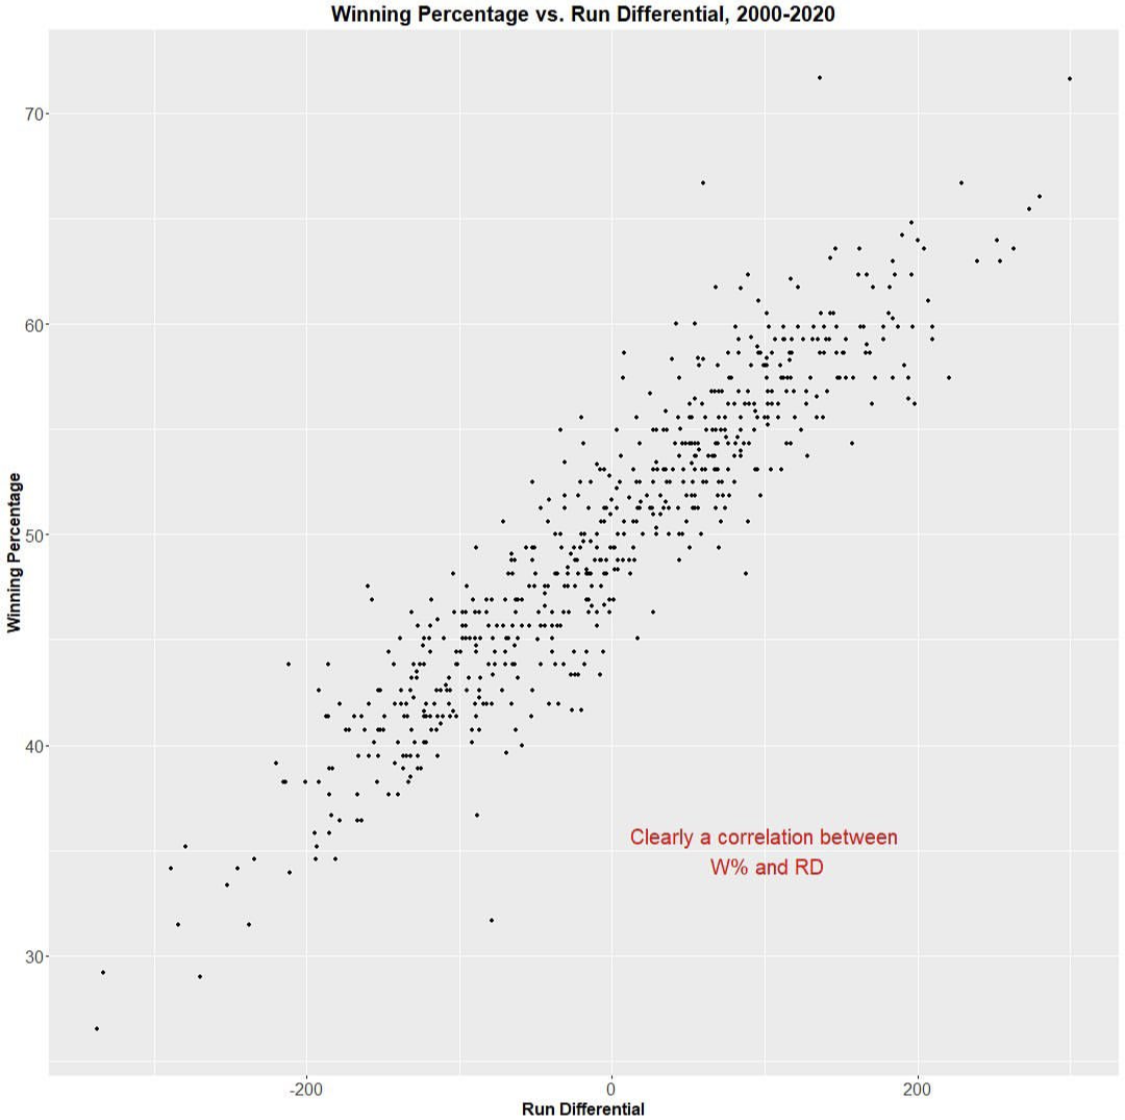
Here is the correlation between W% and run difference in the MLB from 2000-2020 (since run difference directly affects pythagorean wins). There is a clear correlation between winning and run difference so we can assume that the best way to assess a team’s performance is by measuring their run difference, hence the use of pythagorean wins.
To further explore pythagorean wins in the MLB I used 10 years of standings data from 2010 - 2020, and used Wins over Expected, which is total actual wins minus pythagorean expected wins. With 162 game seasons, there are certain trends that stick out in team performances which may enhance or decrease their win total. Thus, pythagorean wins is important to assess how well a team really is playing.
In this chart below, I graphed Wins over Expected and how many teams in the data have the same amount of Wins over expected.

In this chart, we see a mean of -0.111, and a majority of the data coming from about 1 or 2 wins above average. Higher on the x axis of the chart signifies a “luckier” season; x wins above expected according to pythagorean wins, while lower signifies an “unluckier” season or below expected wins.
And now, for the top 30 luckiest and unluckiest teams: (RECORDS ARE AS OF AUGUST 31st)

The 2016 Texas Rangers lead the luckiest teams with a 13 win differential from their actual win total, 95, and their pythagorean wins, at just 82. At 28, we see the 2020 Miami Marlins who shocked MLB fans by reaching the playoffs in 60 games and winning the first series against the Cubs. Since the 2020 season was only 60 games, there was a smaller sample size of games, and thus the records for teams like the Marlins were unable to start regressing down to their pythagorean expected wins.
Another interesting to not: the Rangers in 2017 following their 2016 over performance dropped to a 78-84 record. The Padres at second on this list dropped to a 66-96 record, and the Mariners the next season down to 68-94. This trend continues, although not entirely, throughout the list. Thus, we can see that perhaps pythagorean wins are a good predictive stat to measure how well a team will fare the next season barring any drastic improvements overall to the team.
And finally, the “unlucky” teams of the past decade.

Here, we still see a similar trends, where some of these teams made a jump (though admittedly not by very much) in their records, with exception to the 2015 Oakland A’s.
Overall, we can see that expected wins in both the NFL and MLB are an example of using “process instead of results.” It measures how a team wins, rather than whether or not they win. And often, measuring how your team wins is more important than actually winning itself, in regards to the future. Front offices themselves in both leagues have also begun using this metric to make decisions (i.e. the 2018 Mariners who sold off Edwin Diaz and Robinson Cano because they recognized how much they had overperformed that past season). In conclusion, pythagorean wins may just be a more accurate processed based metric that best assesses a team’s true performance.